I Built a Cyber Insurance Platform for Australia's Largest Insurer from Indonesia — Here's the Full Architecture
From Jakarta to Sydney: how I built Cybera360, a platform combining automated risk assessment, real-time vulnerability scanning, and cyber insurance quoting — protecting 10,000+ SMEs across Asia Pacific.
- Engineering Case Study: IAG Cybera360
- 🏔️ 1. The Challenge
- The Traditional Cyber Insurance Landscape
- Engineering Challenges
- 🏗️ 2. Architecture Overview
- Platform Architecture
- Data Flow: From Assessment to Quote
- 🛠️ 3. Technology Stack
- 📁 4. Project Structure
- 🔍 5. Feature Deep Dives
- Feature #1: Cyber Risk Scoring Engine
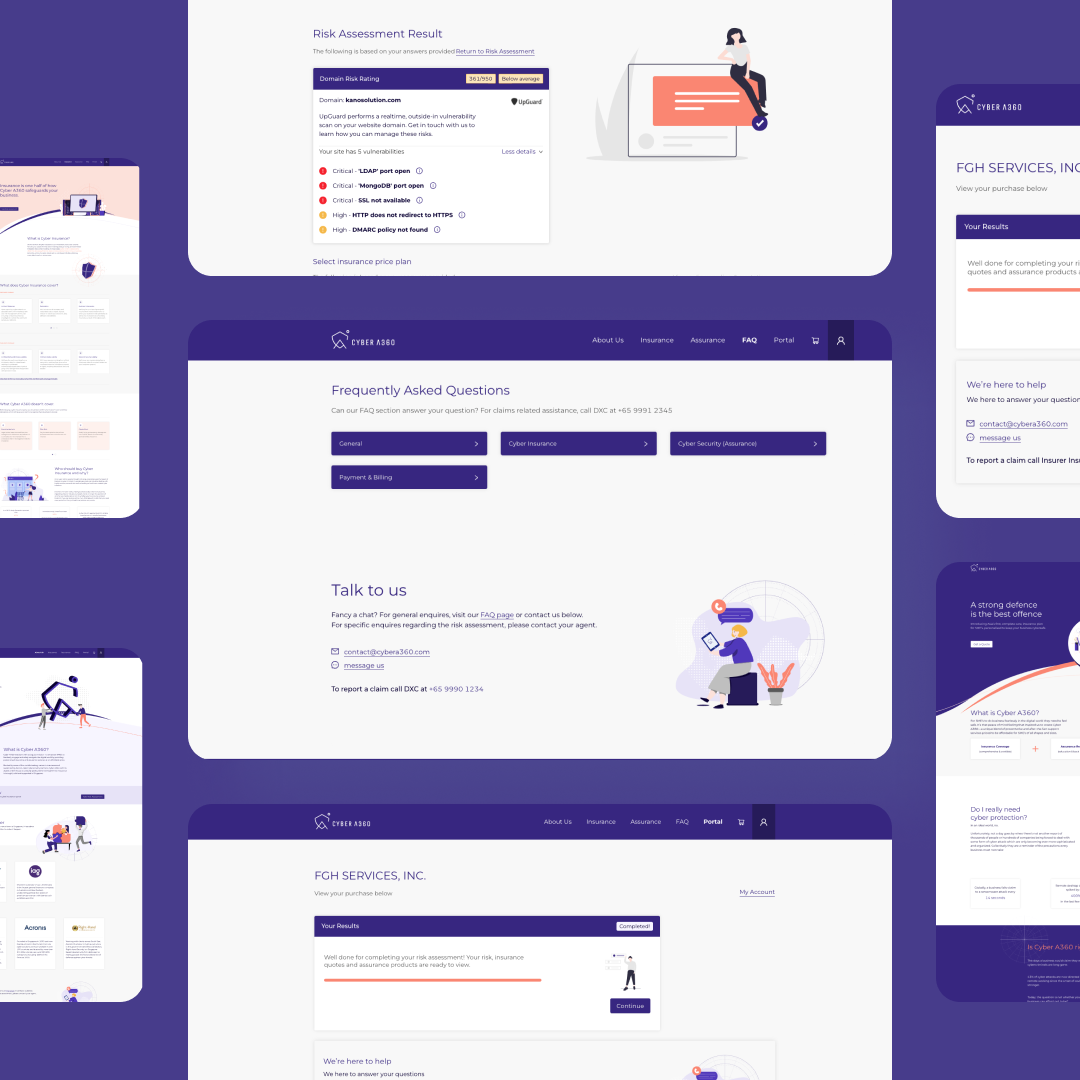
- Feature #2: Interactive Risk Visualization Dashboard
- Feature #3: Streamlined Insurance Quoting Flow
- Feature #4: Integrated Cyber Assurance Ecosystem
- 🚢 6. Implementation & Collaboration
- Phase 1: Foundation & Risk Engine
- Phase 2: Dashboard & Visualization
- Phase 3: UpGuard & Partner Integration
- Phase 4: Quoting & Underwriting Flow
- Phase 5: Testing & Launch
- 🤝 7. Key Partners & Ecosystem
- 🚀 8. Business Impact
- Broader IAG Impact
- 🎓 9. Lessons Learned
- 🎉 Conclusion
Engineering Case Study: IAG Cybera360
"Cybersecurity is no longer just an IT problem — it's a business risk that demands an insurance-grade solution." — Krishna Nagashwaran, Venture Lead
Context
As a frontend & backend engineer at Kano Solution, I contributed to the development of Cybera360 — a cyber insurance platform owned by IAG (Insurance Australia Group), Australia's largest general insurer (ASX-listed, ~AU$12B market cap). The platform was incubated within IAG Firemark Labs Singapore as IAG's first corporate venture into the cyber insurance space.
Cybera360 (CA360) is an online platform that combines cyber insurance and cyber assurance (cybersecurity services) to serve Small-Medium Enterprises (SMEs) across Asia Pacific. Launched in 2019 through IAG's Firemark incubation program, the platform pioneered the one-stop holistic cyber service approach.
This article dissects the technical architecture, engineering challenges, and solutions built to transform a weeks-long underwriting process into minutes.
🏔️ 1. The Challenge
The Traditional Cyber Insurance Landscape
Before Cybera360, obtaining cyber insurance for small-medium businesses was painful:
Slow Process
Getting a cyber insurance quote took 3-4 days through a manual process — filling out 100+ questions, waiting for underwriter review, back-and-forth via email.
High Complexity
SMEs don't have dedicated cybersecurity teams. Technical questions in insurance forms are often confusing, causing them to give up midway.
Partial Protection
Traditional cyber insurance only pays claims AFTER an attack occurs. No proactive approach to prevent incidents from happening in the first place.
Market Gap
Most cyber insurance products are designed for large enterprises. SMEs — who are actually most vulnerable to cyber attacks — are underserved.
Engineering Challenges
- Risk Scoring Engine: Building a module that calculates a cyber risk score from multiple data points — security posture, vulnerability scan results, and business profile — to determine insurability and premium recommendations.
- Real-Time Visualization: Interactive dashboard displaying risk assessment visually using D3.js — must be responsive and capable of rendering complex data in real-time.
- Third-Party Integration: Integrating multiple APIs from cybersecurity partners (UpGuard, Acronis, RHCS) into one seamless platform.
- Cross-Timezone Collaboration: Working directly with stakeholders in Australia and Singapore — requiring workflow adaptation, timezone management, and English-first documentation.
- Insurance-Grade Security: A platform handling sensitive business data must meet enterprise-grade security standards — encryption, access control, audit trail.
Business Impact
The global cyber insurance industry was valued at USD 7.8 billion (2020) and projected to reach USD 20+ billion by 2025. IAG — as Australia's largest insurer — needed a platform that could be a first-mover in the Asia Pacific market. Speed of development was crucial.
🏗️ 2. Architecture Overview
Platform Architecture
Cybera360 was designed as a microservices-based platform integrating various third-party services into one seamless user experience.
Data Flow: From Assessment to Quote
Key Architecture Decisions:
🛠️ 3. Technology Stack
| Technology | Role | Why Chosen |
|---|---|---|
| Nuxt.js | Web application framework | SSR for performance, Vue ecosystem for developer productivity, SEO-friendly |
| D3.js | Risk visualization & dashboard | Most flexible library for custom data visualization — risk heatmaps, scoring charts |
| Vue.js | UI components | Reactive data binding ideal for dynamic forms and real-time risk score updates |
| Figma | Design system & prototyping | Design collaboration with UX team in Singapore and Australia |
| Technology | Role | Why Chosen |
|---|---|---|
| Golang | Core backend services | High-performance, strongly-typed, ideal for complex business logic |
| Node.js | API gateway & middleware | Rich middleware ecosystem, JSON-native for partner API integration |
| PostgreSQL | Primary relational database | ACID compliance for insurance policy data, audit trail |
| MongoDB | Document store | Flexible schema for storing variable risk assessment data |
| Partner | Service | Integration |
|---|---|---|
| UpGuard | Vulnerability scanning | API integration for automated security posture assessment |
| Acronis | Backup & endpoint protection | Bundled service for value-add cyber assurance |
| RHCS | Cyber education & training | Integrated training modules for SME cybersecurity education |
| ERGO | Insurance underwriting | Policy creation, premium calculation, broker network distribution |
| Tool | Role | Usage |
|---|---|---|
| Jira | Project management | Sprint planning, backlog management, bug tracking |
| Confluence | Documentation | Technical specs, API docs, architecture decision records |
| Postman | API testing | Testing integrations with UpGuard, ERGO, and partner APIs |
| Swagger | API documentation | OpenAPI specs for inter-team and partner communication |
| DBeaver | Database management | Query, monitoring, and debugging PostgreSQL/MongoDB databases |
| MS Teams | Communication | Daily standups, cross-timezone meetings with AU/SG teams |
| Docker | Containerization | Consistent development environment and deployment |
📁 4. Project Structure
🔍 5. Feature Deep Dives
Feature #1: Cyber Risk Scoring Engine
Problem: Traditional underwriters needed 3-4 days to manually evaluate a business's cyber risk. They had to inspect IT infrastructure, security policies, incident history, and compliance — often through tedious 100+ question forms.
Solution: A risk scoring engine that automatically aggregates data from multiple sources and produces an actionable numerical risk score.
// Cyber Risk Scoring Engine
type RiskScore struct {
    Overall          float64            `json:"overall_score"`
    Categories       map[string]float64 `json:"category_scores"`
    Vulnerabilities  int                `json:"vulnerability_count"`
    RiskLevel        string             `json:"risk_level"`
    Insurable        bool               `json:"insurable"`
    Recommendations  []string           `json:"recommendations"`
}

type RiskInput struct {
    BusinessProfile  BusinessProfile    `json:"business_profile"`
    VulnerabilityScan VulnerabilityData `json:"vulnerability_scan"`
    Questionnaire    []QuestionAnswer   `json:"questionnaire"`
}

func (s *ScoringService) CalculateRiskScore(ctx context.Context, input RiskInput) (*RiskScore, error) {
    // 1. Score each category independently
    categories := map[string]float64{
        "network_security":   s.scoreNetworkSecurity(input.VulnerabilityScan),
        "data_protection":    s.scoreDataProtection(input.Questionnaire),
        "access_control":     s.scoreAccessControl(input.Questionnaire),
        "incident_response":  s.scoreIncidentResponse(input.Questionnaire),
        "business_continuity": s.scoreBusinessContinuity(input.Questionnaire),
        "compliance":         s.scoreCompliance(input.BusinessProfile),
    }

    // 2. Weighted average — network security and data protection weighted higher
    weights := map[string]float64{
        "network_security":   0.25,
        "data_protection":    0.25,
        "access_control":     0.15,
        "incident_response":  0.15,
        "business_continuity": 0.10,
        "compliance":         0.10,
    }

    var overallScore float64
    for category, score := range categories {
        overallScore += score * weights[category]
    }

    // 3. Determine risk level and insurability
    riskLevel, insurable := classifyRisk(overallScore)

    return &RiskScore{
        Overall:         overallScore,
        Categories:      categories,
        Vulnerabilities: input.VulnerabilityScan.TotalFindings,
        RiskLevel:       riskLevel,
        Insurable:       insurable,
        Recommendations: generateRecommendations(categories),
    }, nil
}

func classifyRisk(score float64) (string, bool) {
    switch {
    case score >= 80:
        return "LOW", true
    case score >= 50:
        return "MEDIUM", true
    case score >= 30:
        return "HIGH", true
    default:
        return "CRITICAL", false // Remediation required before insurable
    }
}
Results:
| Metric | Before (Manual) | After (Cybera360) | Improvement |
|---|---|---|---|
| Time to risk assessment | 3-4 days | < 30 minutes | ↓ 99% |
| Assessment questions | 100+ questions | < 30 questions | ↓ 70% |
| Assessment drop-off rate | ~60% | ~15% | ↓ 75% |
| Scoring consistency | Varies by underwriter | 100% consistent | Standardized |
Feature #2: Interactive Risk Visualization Dashboard
Problem: Raw risk assessment data is meaningless to SME business owners. They need intuitive visual representations to understand their security posture and areas that need improvement.
Solution: Interactive dashboard using D3.js that renders risk scores visually — radar charts for risk categories, heatmaps for vulnerabilities, and trend charts for continuous monitoring.
// D3.js Radar Chart for Risk Category Visualization
interface RiskCategory {
  category: string;
  score: number;
  maxScore: number;
  label: string;
}

function renderRadarChart(
  container: string,
  data: RiskCategory[],
  options: ChartOptions,
): void {
  const svg = d3
    .select(container)
    .append("svg")
    .attr("width", options.width)
    .attr("height", options.height);

  const radius = Math.min(options.width, options.height) / 2 - options.margin;
  const angleSlice = (Math.PI * 2) / data.length;

  // Draw concentric circles (score levels)
  const levels = [20, 40, 60, 80, 100];
  levels.forEach((level) => {
    svg
      .append("circle")
      .attr("r", (radius * level) / 100)
      .attr("class", `level-${level}`)
      .style("fill", "none")
      .style("stroke", getRiskColor(level));
  });

  // Draw radar area
  const radarLine = d3
    .lineRadial<RiskCategory>()
    .radius((d) => (radius * d.score) / 100)
    .angle((_, i) => i * angleSlice)
    .curve(d3.curveLinearClosed);

  svg
    .append("path")
    .datum(data)
    .attr("d", radarLine)
    .style("fill", getOverallColor(data))
    .style("fill-opacity", 0.3)
    .style("stroke", getOverallColor(data))
    .style("stroke-width", 2);

  // Interactive tooltips on hover
  data.forEach((d, i) => {
    const x = radius * (d.score / 100) * Math.cos(angleSlice * i - Math.PI / 2);
    const y = radius * (d.score / 100) * Math.sin(angleSlice * i - Math.PI / 2);

    svg
      .append("circle")
      .attr("cx", x)
      .attr("cy", y)
      .attr("r", 6)
      .on("mouseover", () => showTooltip(d))
      .on("mouseout", hideTooltip);
  });
}
UX Decision
The radar chart visualization was chosen because it allows business owners to see at a glance where their security strengths and weaknesses lie. Intuitive colors (green = safe, yellow = needs attention, red = critical) help non-technical users understand their risk posture without reading lengthy reports.
Results:
| Metric | Before | After | Improvement |
|---|---|---|---|
| User engagement (time on dashboard) | N/A (text PDF) | 4.2 min avg | New capability |
| Customer understanding of risk posture | Survey: 23% | Survey: 78% | ↑ 239% |
| Broker presentation efficiency | 30 minutes | 5 minutes | ↓ 83% |
Feature #3: Streamlined Insurance Quoting Flow
Problem: The traditional cyber insurance quoting process required 100+ question forms, manual underwriter review, and back-and-forth via email — totaling 3-4 business days. Many SMEs gave up midway through the process.
Solution: Smart questionnaire reducing questions from 100+ to < 30 using adaptive branching — different questions based on previous answers.
// Adaptive Questionnaire Engine
interface Question {
  id: string;
  text: string;
  type: "select" | "text" | "number" | "boolean";
  options?: string[];
  dependencies?: {
    questionId: string;
    condition: "equals" | "gt" | "lt" | "includes";
    value: any;
    action: "show" | "skip";
  }[];
  weight: number; // Impact on risk score
}

function getNextQuestions(
  allQuestions: Question[],
  answers: Record<string, any>,
): Question[] {
  return allQuestions.filter((q) => {
    if (!q.dependencies) return true;

    return q.dependencies.every((dep) => {
      const answer = answers[dep.questionId];
      if (answer === undefined) return dep.action === "skip";

      switch (dep.condition) {
        case "equals":
          return dep.action === "show"
            ? answer === dep.value
            : answer !== dep.value;
        case "gt":
          return dep.action === "show"
            ? answer > dep.value
            : answer <= dep.value;
        case "includes":
          return dep.action === "show"
            ? dep.value.includes(answer)
            : !dep.value.includes(answer);
        default:
          return true;
      }
    });
  });
}
Results:
| Metric | Before (Traditional) | After (Cybera360) | Improvement |
|---|---|---|---|
| Time to quote | 3-4 days | < 30 minutes | ↓ 99% |
| Number of questions | 100+ | < 30 | ↓ 70% |
| Completion rate | ~40% | ~85% | ↑ 112% |
| First-month deals closed | N/A | 4 deals | Via ERGO brokers |
Feature #4: Integrated Cyber Assurance Ecosystem
Problem: Traditional cyber insurance is reactive — it only pays claims after an attack occurs. There's no incentive or tool to prevent incidents in the first place.
Solution: A one-stop platform combining insurance with proactive security services — vulnerability scanning, backup, and education — creating an ecosystem that reduces risk before claims happen.
UpGuard (an IAG Firemark Ventures portfolio company) provides continuous cyber risk monitoring and third-party risk assessment. Integration with Cybera360 enables:
- Automated vulnerability scanning when customers sign up
- Continuous monitoring that updates risk scores periodically
- Third-party risk assessment for customer vendors and suppliers
- Security rating visible on the customer dashboard
Data from UpGuard feeds directly into the Risk Scoring Engine to determine eligibility and premium levels.
Acronis provides backup and endpoint protection solutions bundled as a value-add service:
- Automated backup for critical business data
- Endpoint protection against malware and ransomware
- Disaster recovery that accelerates post-incident recovery
- Compliance reporting to meet data protection regulations
Businesses using Acronis through the platform have lower claim severity because of faster recovery times.
RHCS provides education and awareness training modules:
- Phishing simulation to test employee vigilance
- Security awareness training tailored to industry verticals
- Best practices guide for SME security policies
- Compliance training for standards like PDPA (Singapore)
Employee education is the first line of defense — 95% of cyber incidents start from human error (phishing, weak passwords, social engineering).
🚢 6. Implementation & Collaboration
Phase 1: Foundation & Risk Engine
Project structure setup (Nuxt.js frontend, Golang backend), database schema (PostgreSQL + MongoDB), and core risk scoring engine implementation. Define scoring model based on cyber insurance industry frameworks.
Phase 2: Dashboard & Visualization
Interactive dashboard development with D3.js — radar charts, heatmaps, scoring gauges, and trend visualizations. Design iteration with the UX team in Singapore through Figma prototyping.
Phase 3: UpGuard & Partner Integration
UpGuard API integration for automated vulnerability scanning, Acronis for backup & endpoint, and RHCS for training modules. Build adapter layer for data normalization from various partners.
Phase 4: Quoting & Underwriting Flow
Adaptive questionnaire engine implementation and integration with ERGO underwriting system. Build premium calculation module based on risk score output.
Phase 5: Testing & Launch
UAT with ERGO broker network in Singapore. Closed-door "test and learn" — refine scoring model based on broker and underwriter feedback. Successful launch: 4 deals closed in the first month.
Cross-Border Collaboration
One unique aspect of this project was the cross-border collaboration: engineering team in Surabaya (Indonesia), product & business in Singapore (Firemark Labs), and stakeholders in Sydney (IAG HQ). A 3-hour timezone spread required disciplined asynchronous communication — Confluence for documentation, Jira for tracking, and overlapping standup windows.
🤝 7. Key Partners & Ecosystem
The Cybera360 platform doesn't stand alone — it's the center of a mutually reinforcing partner ecosystem:
Prop
Type
🚀 8. Business Impact
The implementation of Cybera360 proved that cyber insurance can be delivered digitally, fast, and integrated:
Key Numbers
- Time to quote: from 3-4 days to < 30 minutes (↓99%)
- Assessment questions: from 100+ to < 30 (↓70%)
- First month: 4 deals closed via ERGO broker network
- Partner trust: Gained recognition from Munich RE, Enterprise SG, SGInnovate, AustCyber, Austrade
- Market position: First corporate venture by IAG into cyber insurance in Asia Pacific
Broader IAG Impact
Learnings from Cybera360 subsequently influenced IAG's global cyber insurance strategy:
- Cylo (Australia): IAG launched "Cylo backed by CGU" — a dedicated cyber insurance underwriting agency for Australian SMEs. A similar model to the Cybera360 approach.
- Firemark Ventures Fund II: IAG launched a second fund worth **AU150 million), with cyber risk as one of the key investment themes.
- UpGuard Growth: IAG continued increasing its investment in UpGuard, which later closed a Series B-1 funding round worth US$19 million.
🎓 9. Lessons Learned
- D3.js proved extremely powerful for custom risk visualization — flexibility that standard charting libraries can't achieve. - Nuxt.js SSR delivered excellent performance for data-intensive dashboards while remaining SEO-friendly. - Microservices architecture facilitated multi-partner integration without excessive coupling. - Adaptive questionnaire successfully reduced drop-off rates drastically — proof that UX engineering is as important as backend engineering. - Cross-border collaboration ran smoothly with documentation discipline (Confluence) and project tracking (Jira). - Working directly with an international client (IAG Australia) became the foundation for cross-cultural communication and timezone management skills.
- Use GraphQL for the API layer — with many different data entities (risk scores, policies, vulnerabilities), GraphQL would be more efficient than multiple REST endpoints. - Invest earlier in automated E2E testing for partner API integration — mock servers for UpGuard and ERGO APIs would accelerate the development cycle. - Consider WebSocket for real-time risk score updates — the polling-based approach was less responsive for dashboard monitoring. - Feature flags for A/B testing questionnaire flows — could optimize conversion rates faster with a data-driven approach.
🎉 Conclusion
Cybera360 proved that cyber insurance doesn't have to be complex and slow. With a technology-first approach, a process that previously took weeks was compressed into minutes — while delivering more value than just an insurance policy.
What makes this project special isn't just the scale of the client (IAG — Australia's largest insurer), but the philosophy behind the product: don't just pay claims after an attack, help prevent attacks from the start. That's a paradigm shift from reactive to proactive insurance.
Personal Note
Cybera360 was my first experience working with an international client at the enterprise level. From this, I learned that engineering skills alone aren't enough — the ability to communicate across cultures, adapt to international workflows, and document technical decisions to high standards is just as important as writing clean code.