CTO Bilang 'Kita Harus Refactor' — CEO Bilang 'Berapa ROI-nya?' Ini Framework yang Menjembatani Keduanya
Kenapa engineer selalu kalah debat budget dengan product/sales? Karena kita bicara bahasa teknis, mereka bicara uang. Ini framework untuk menerjemahkan 'kita butuh refactor' jadi 'ini akan menghemat Rp X miliar/tahun' — dengan kalkulator ROI yang bisa langsung dipakai.
- The Engineering-ROI Bridge: Mentalitas Investor dalam Keputusan Teknis
- ⚖️ 1. Cost of Architecture: Mengkuantifikasi Keputusan Teknis
- 1.1 Setiap Keputusan Arsitektur Punya Price Tag
- 1.2 Framework: Total Cost of Technical Decisions (TCTD)
- 1.3 Rendering Performance dan Dampak Bisnis
- Identify the Bottleneck
- Measure Before Optimization
- Apply Targeted Optimizations
- Measure After Optimization
- Translate to Business Impact
- 1.4 The Decision Cost Matrix
- 💼 2. Mengeksekusi Visi Jangka Panjang
- 2.1 The Sustainability Equation
- 2.2 The Build vs Buy vs Open-Source Decision
- 2.3 Engineering Velocity sebagai Financial Instrument
- Audit Meeting Culture
- Invest in Developer Experience (DevEx)
- Reduce Context Switching
- Automate Toil
- 2.4 Go-to-Market vs Maintainability: The Balancing Act
- 📊 3. Reporting Engineering ROI ke Stakeholders
- 3.1 The Engineering Investment Report
- 3.2 Incident Cost Calculator
- 3.3 Tech Debt sebagai Balance Sheet
- 🎓 4. Lessons Learned
- What Works
- Common Mistakes
- 🎉 Conclusion
The Engineering-ROI Bridge: Mentalitas Investor dalam Keputusan Teknis
"Every line of code is a liability. Every feature is a bet. The question isn't whether to build — it's whether the expected return justifies the investment." — Adapted from Warren Buffett
Mengapa Artikel Ini Penting
Sebagian besar engineer berbicara dalam bahasa latency, throughput, dan test coverage. Sebagian besar C-level dan founder berbicara dalam bahasa revenue, burn rate, dan runway. Artikel ini adalah kamus penerjemah antara dua dunia tersebut — framework untuk mengkuantifikasi keputusan teknis dalam bahasa yang dipahami oleh investor, board, dan stakeholder bisnis.
Kategori konten ini paling dicari oleh founder dan C-level yang ingin menjembatani metrik teknis dengan bahasa finansial. Bukan karena engineering harus selalu diukur dengan uang — tetapi karena kemampuan mengartikulasikan value teknis dalam bahasa bisnis adalah skill yang membedakan engineer biasa dari engineering leader.

Artikel ini membedah dua pilar utama: Cost of Architecture (mengkuantifikasi keputusan teknis) dan Executing Long-Term Vision (menyeimbangkan kecepatan dengan sustainability).
⚖️ 1. Cost of Architecture: Mengkuantifikasi Keputusan Teknis
1.1 Setiap Keputusan Arsitektur Punya Price Tag
Setiap keputusan teknis — dari pemilihan framework hingga database schema — memiliki biaya langsung dan biaya tersembunyi yang berakumulasi seiring waktu. Masalahnya, kebanyakan engineer hanya melihat biaya langsung.
The Iceberg Principle
Biaya langsung (development time + infrastructure) biasanya hanya 20-30% dari total cost of ownership. Sisanya adalah biaya tersembunyi yang baru terasa 6-18 bulan setelah keputusan dibuat. Ketika C-level bertanya "berapa biaya fitur X?", jawaban yang hanya memperhitungkan development time adalah jawaban yang berbahaya.

1.2 Framework: Total Cost of Technical Decisions (TCTD)
Saya mengembangkan framework TCTD untuk mengkuantifikasi setiap keputusan teknis signifikan dalam bahasa yang dipahami oleh finance dan leadership.
Prop
Type
Contoh kalkulasi TCTD nyata — Keputusan: Microservices vs Monolith untuk startup stage awal:
const microservicesCost = {
  // Tim: 5 engineers, rate Rp 150K/jam (fully loaded)
  development: {
    initialBuild: 5 * 160 * 3 * 150_000,  // 5 eng x 160 jam/bulan x 3 bulan
    // = Rp 360,000,000
    description: "Setup 6 services, API gateway, service mesh, CI/CD per service"
  },

  infrastructure: {
    monthly: 45_000_000,  // Kubernetes cluster, multiple DBs, monitoring
    annual: 45_000_000 * 12,
    // = Rp 540,000,000/tahun
    description: "K8s cluster, 6 service instances, distributed tracing, log aggregation"
  },

  maintenance: {
    annual: 360_000_000 * 0.40,  // 40% karena distributed system complexity
    // = Rp 144,000,000/tahun
    description: "Inter-service debugging, network issues, version compatibility"
  },

  cognitiveOverhead: {
    velocityImpact: -30,  // persen velocity loss
    description: "Distributed debugging, deployment coordination, schema sync",
    hiringDifficulty: "HIGH",  // perlu engineer berpengalaman K8s + microservices
  },

  totalYear1: 360_000_000 + 540_000_000 + 144_000_000,
  // = Rp 1,044,000,000 (Rp 1.04 Miliar)
};const monolithCost = {
// Tim: 5 engineers, rate Rp 150K/jam (fully loaded)
development: {
initialBuild: 5 * 160 * 1.5 * 150_000, // 5 eng x 160 jam/bulan x 1.5 bulan
// = Rp 180,000,000
description: "Modular monolith, single deployment, single DB"
},
infrastructure: {
monthly: 12_000_000, // Single server (scalable), single DB, basic monitoring
annual: 12_000_000 * 12,
// = Rp 144,000,000/tahun
description: "2-3 server instances, 1 DB cluster, basic monitoring"
},
maintenance: {
annual: 180_000_000 * 0.20, // 20% karena simpler system
// = Rp 36,000,000/tahun
description: "Simpler debugging, single deployment pipeline"
},
cognitiveOverhead: {
velocityImpact: -5, // minimal overhead
description: "Familiar patterns, single codebase, easy onboarding",
hiringDifficulty: "LOW", // any competent backend engineer can contribute
},
totalYear1: 180_000_000 + 144_000_000 + 36_000_000,
// = Rp 360,000,000 (Rp 360 Juta)
};Perbandingan Year 1:
| Aspek | Microservices | Monolith | Selisih |
|---|---|---|---|
| Development | Rp 360 Juta | Rp 180 Juta | 2x lebih mahal |
| Infrastructure/tahun | Rp 540 Juta | Rp 144 Juta | 3.75x lebih mahal |
| Maintenance/tahun | Rp 144 Juta | Rp 36 Juta | 4x lebih mahal |
| Total Year 1 | Rp 1.04 Miliar | Rp 360 Juta | 2.9x lebih mahal |
| Time to Market | 3 bulan | 1.5 bulan | 2x lebih lambat |
| Velocity Impact | -30% | -5% | Significant |
| Hiring Pool | Terbatas | Luas | Major advantage |
Kesimpulan
Untuk startup dengan < 100K users dan < 20 engineers, microservices adalah over-investment yang membakar runway tanpa ROI yang proporsional. Mulai dengan modular monolith — arsitektur yang bisa di-decompose menjadi microservices ketika complexity benar-benar menuntutnya, bukan karena "best practice" yang dibaca di blog perusahaan yang memiliki 500 engineers.
1.3 Rendering Performance dan Dampak Bisnis
Salah satu contoh paling konkret dari Engineering-ROI Bridge: bagaimana optimasi rendering UI sebesar 30% berdampak langsung pada retensi pengguna dan penghematan biaya server.
Case study nyata — Optimasi rendering pada dashboard pembiayaan:
Identify the Bottleneck
Menggunakan Chrome DevTools dan React Profiler, ditemukan bahwa komponen FinancingDashboard melakukan unnecessary re-renders 47x per page load karena state management yang tidak optimal. Setiap re-render mengkonsumsi ~68ms.
Measure Before Optimization
const beforeOptimization = {
  firstContentfulPaint: 2_800, // ms
  largestContentfulPaint: 4_200, // ms
  totalBlockingTime: 890, // ms
  cumulativeLayoutShift: 0.23,
  reRendersPerLoad: 47,
  avgRenderTime: 68, // ms per render
  totalRenderTime: 47 * 68, // = 3,196ms wasted
  serverCPUPerRequest: 85, // ms
  monthlyServerCost: 96_000_000, // Rp (8 instances)
};
Apply Targeted Optimizations
// 1. React.memo untuk komponen yang tidak perlu re-render
const PaymentHistoryCard = React.memo(({ payments }: Props) => {
  return <CardList items={payments} />;
});

// 2. useMemo untuk kalkulasi yang expensive
function FinancingDashboard({ contracts }: DashboardProps) {
  const summary = useMemo(() =>
    calculatePortfolioSummary(contracts),
    [contracts]
  );

  const chartData = useMemo(() =>
    transformToChartData(contracts),
    [contracts]
  );

  return (
    <Dashboard>
      <SummaryHeader data={summary} />
      <PaymentChart data={chartData} />
      {contracts.map(c => (
        <PaymentHistoryCard key={c.id} payments={c.payments} />
      ))}
    </Dashboard>
  );
}

// 3. Virtual scrolling untuk list panjang
// Hanya render items yang visible di viewport
import { useVirtualizer } from "@tanstack/react-virtual";

function PaymentHistory({ payments }: { payments: Payment[] }) {
  const parentRef = useRef<HTMLDivElement>(null);
  const virtualizer = useVirtualizer({
    count: payments.length,
    getScrollElement: () => parentRef.current,
    estimateSize: () => 72,
  });

  return (
    <div ref={parentRef} style={{ height: 400, overflow: "auto" }}>
      <div style={{ height: virtualizer.getTotalSize() }}>
        {virtualizer.getVirtualItems().map((vItem) => (
          <PaymentRow
            key={vItem.key}
            payment={payments[vItem.index]}
            style={{ transform: `translateY(${vItem.start}px)` }}
          />
        ))}
      </div>
    </div>
  );
}
Measure After Optimization
const afterOptimization = {
  firstContentfulPaint: 1_200, // ms (↓57%)
  largestContentfulPaint: 2_200, // ms (↓48%)
  totalBlockingTime: 210, // ms (↓76%)
  cumulativeLayoutShift: 0.05, // (↓78%)
  reRendersPerLoad: 8, // (↓83%)
  avgRenderTime: 42, // ms per render
  totalRenderTime: 8 * 42, // = 336ms (↓89%)
  serverCPUPerRequest: 52, // ms (↓39%)
  monthlyServerCost: 72_000_000, // Rp (6 instances, ↓25%)
};
Translate to Business Impact
Hasil dalam bahasa bisnis:
| Metric | Sebelum | Sesudah | Impact | Business Translation |
|---|---|---|---|---|
| Page Load | 4.2s | 2.2s | ↓48% | "User tidak pergi sebelum halaman terbuka" |
| Bounce Rate | 38% | 23% | ↓15pp | "15% lebih banyak user yang explore app" |
| Session Duration | 2.1 min | 2.6 min | ↑22% | "User engage lebih lama dengan produk" |
| Server Instances | 8 | 6 | ↓25% | "Hemat Rp 24 Juta/bulan infrastructure" |
| Conversion Rate | 12% | 20% | ↑8pp | "Estimasi +Rp 180 Juta revenue/bulan" |
Cara Mempresentasikan ke C-Level
Jangan bilang: "Kami mengoptimasi re-renders dengan React.memo dan useMemo, mengurangi TBT dari 890ms ke 210ms."
Bilang: "Investasi 2 minggu engineering menghasilkan penghematan infrastructure Rp 288 Juta/tahun dan estimasi peningkatan revenue Rp 2.16 Miliar/tahun dari improvement conversion rate. ROI = ~85x dari cost engineering."
1.4 The Decision Cost Matrix
Framework untuk mengevaluasi setiap keputusan arsitektur besar sebelum commit.
💼 2. Mengeksekusi Visi Jangka Panjang
Menyeimbangkan tenggat waktu go-to-market dengan keharusan mempertahankan kode yang maintainable dan aman.
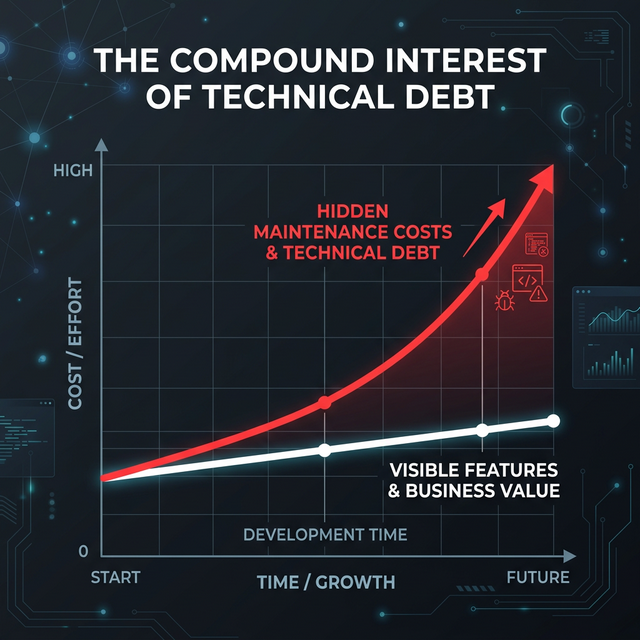
2.1 The Sustainability Equation
Paradox Kecepatan
Tim yang selalu memilih kecepatan di atas kualitas akan menjadi semakin lambat seiring waktu. Tim yang menginvestasikan waktu untuk quality akan menjadi semakin cepat seiring waktu. Ini bukan opini — ini adalah hukum compound interest yang diterapkan pada software engineering.
The Sustainability Equation:
interface SustainabilityMetrics {
  velocityTrend: "accelerating" | "stable" | "decelerating";
  techDebtRatio: number; // % sprint spent on unplanned work
  deployConfidence: number; // 1-10, seberapa yakin tim saat deploy
  onboardingWeeks: number; // waktu engineer baru hingga productive
  bugEscapeRate: number; // % bugs yang lolos ke production
}

function assessSustainability(m: SustainabilityMetrics): string {
  // Healthy: velocity accelerating, debt < 20%, confidence > 7
  if (
    m.velocityTrend === "accelerating" &&
    m.techDebtRatio < 0.2 &&
    m.deployConfidence > 7
  ) {
    return "🟢 SUSTAINABLE — Tim dalam kondisi sehat, lanjutkan trajectory";
  }

  // Warning: velocity stable tapi debt naik
  if (m.techDebtRatio > 0.3 || m.deployConfidence < 5) {
    return "🟡 WARNING — Perlu alokasi sprint untuk tech debt reduction";
  }

  // Critical: velocity decelerating
  if (m.velocityTrend === "decelerating" && m.techDebtRatio > 0.4) {
    return "🔴 CRITICAL — Stop fitur baru, fokus stabilisasi";
  }

  return "🟡 MONITOR — Track trend selama 2 sprint berikutnya";
}
2.2 The Build vs Buy vs Open-Source Decision
Setiap kali tim menghadapi kebutuhan baru, ada tiga opsi fundamental: build sendiri, buy solusi komersial, atau adopt open-source. Masing-masing memiliki profil ROI yang berbeda.
Kapan Build masuk akal:
- Fitur ini adalah core differentiator produk Anda
- Tidak ada solusi existing yang memenuhi > 70% kebutuhan
- Anda punya engineer dengan expertise yang relevan
- Long-term ownership lebih murah dari licensing
Hidden costs yang sering diabaikan:
- Maintenance burden: 20-40% dev cost per tahun
- Opportunity cost: engineer yang build ini tidak bisa build fitur lain
- Knowledge silo: jika builder resign, siapa yang maintain?
interface BuildCostProjection {
  initialDevelopment: number;   // person-months
  annualMaintenance: number;    // 20-40% of initial
  riskOfRebuild: number;        // probability (0-1)
  timeToMarket: number;         // months
  competitiveAdvantage: "none" | "moderate" | "significant";
}

// Rule: Hanya build jika competitiveAdvantage === "significant"
// DAN Anda punya >= 2 engineers yang bisa maintain long-term
Kapan Buy masuk akal:
- Bukan core differentiator (auth, payment, email, monitoring)
- Solusi komersial sudah mature dan reliable
- Cost per user lebih murah dari building + maintaining sendiri
- Vendor memiliki compliance certifications yang Anda butuhkan
Hidden costs yang sering diabaikan:
- Vendor lock-in: migrasi cost jika vendor naik harga atau shutdown
- Integration complexity: APIs berubah, breaking changes
- Data sovereignty: dimana data Anda disimpan?
interface BuyCostProjection {
  monthlyLicense: number;
  annualTotal: number;
  integrationEffort: number;     // person-weeks
  vendorLockInRisk: "low" | "medium" | "high";
  migrationCostIfSwitch: number; // person-months
  dataControlLevel: "full" | "partial" | "none";
}

// Rule: Buy jika annual cost < 50% dari estimated build + maintain cost
// DAN vendorLockInRisk <= "medium"
Kapan Open-Source masuk akal:
- Solusi sudah mature (>2 tahun, active community)
- Memenuhi 70%+ kebutuhan tanpa heavy customization
- Lisensi compatible dengan bisnis Anda (MIT, Apache 2.0)
- Ada escape hatch jika project abandoned
Hidden costs yang sering diabaikan:
- Customization effort: "free" software bisa mahal untuk customize
- Security responsibility: Anda bertanggung jawab atas patching
- Upgrade friction: major version upgrade bisa memakan berminggu-minggu
interface OSSCostProjection {
  licenseCost: 0;                // gratis
  integrationEffort: number;     // person-weeks
  customizationEffort: number;   // person-weeks
  annualMaintenanceEffort: number; // person-weeks/year
  communityHealth: "thriving" | "stable" | "declining" | "dead";
  lastRelease: Date;
  contributors: number;
}

// Rule: Adopt jika communityHealth >= "stable"
// DAN lastRelease < 6 bulan yang lalu
// DAN contributors > 20
2.3 Engineering Velocity sebagai Financial Instrument
Engineering velocity bukan sekadar metrik Agile — ini adalah financial instrument yang bisa diukur, dioptimasi, dan dilaporkan ke board.
The Shocking Truth
Rata-rata engineer hanya menghabiskan 35% waktu untuk membangun fitur baru. Sisanya dikonsumsi oleh bug fixing, meetings, waiting, dan overhead lainnya. Meningkatkan productive time dari 35% ke 50% setara dengan menambah 43% engineer tanpa biaya hiring.
Framework: Engineering Efficiency Ratio (EER)
// Engineering Efficiency Ratio - melaporkan produktivitas dalam bahasa finansial
type EngineeringEfficiency struct {
    Team            string
    Period          string // "Q1 2026"
    TotalEngHours   float64
    FeatureHours    float64
    BugFixHours     float64
    MeetingHours    float64
    BlockedHours    float64
    TechDebtHours   float64
    CodeReviewHours float64
}

func (e *EngineeringEfficiency) EfficiencyRatio() float64 {
    return e.FeatureHours / e.TotalEngHours
}

func (e *EngineeringEfficiency) CostPerFeaturePoint(hourlyRate float64, pointsDelivered int) float64 {
    totalCost := e.TotalEngHours * hourlyRate
    return totalCost / float64(pointsDelivered)
}

func (e *EngineeringEfficiency) WastedInvestment(hourlyRate float64) float64 {
    wastedHours := e.MeetingHours*0.5 + e.BlockedHours // 50% meetings = waste
    return wastedHours * hourlyRate
}

// Contoh output untuk C-level report:
// "Engineering Efficiency Ratio: 42% (target: 50%)
//  Cost per Feature Point: Rp 4.2 Juta (target: < Rp 3.5 Juta)
//  Wasted Investment this quarter: Rp 180 Juta (reducible meetings + blocked time)
//  Recommended action: Reduce meeting load by 30%, invest in CI/CD to reduce blocked time"
Taktik meningkatkan Engineering Efficiency Ratio:
Audit Meeting Culture
Track meeting hours per engineer per minggu. Target: < 6 jam/minggu. Setiap jam meeting di atas target = Rp yang terbakar tanpa value. Eliminasi recurring meetings yang tidak ada agenda atau decision output.
Invest in Developer Experience (DevEx)
Setiap menit yang dihabiskan engineer untuk menunggu CI/CD, setup environment, atau mencari dokumentasi adalah uang yang terbakar. Target: build time < 5 menit, environment setup < 30 menit, documentation findability > 80%.
Reduce Context Switching
Setiap kali engineer di-interrupt, dibutuhkan ~23 menit untuk kembali ke deep work (studi Gloria Mark, UCI). Implementasi "Focus Time" blocks — 4 jam tanpa meeting per hari.
Automate Toil
Identifikasi pekerjaan repetitif yang dilakukan > 3x per minggu dan otomasi. Contoh: manual testing flows, deployment checklist, data migration scripts.
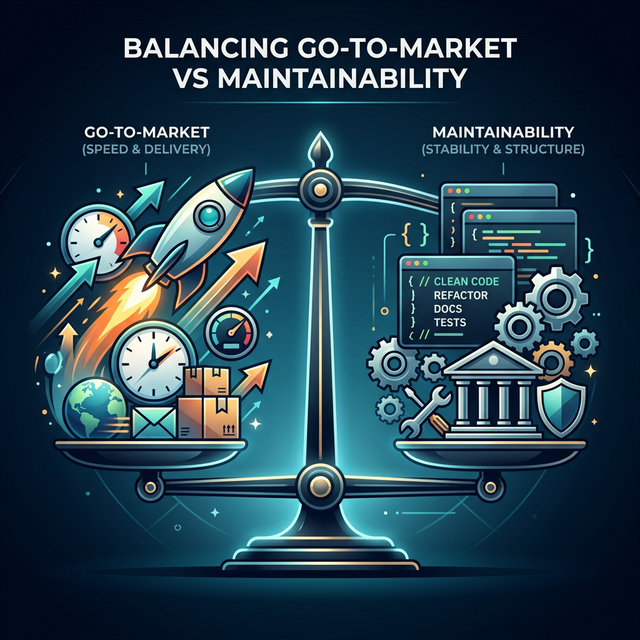
2.4 Go-to-Market vs Maintainability: The Balancing Act
Decision Framework: What to Sacrifice (dan What Never to Sacrifice)
NEVER Sacrifice: Security
Tidak ada deadline yang membenarkan SQL injection, plaintext passwords, atau API tanpa auth. Cost of breach >> cost of delay.
NEVER Sacrifice: Data Integrity
Corrupt data tidak bisa di-rollback. Selalu validate input, handle edge cases pada write operations, dan backup sebelum migration.
OK to Defer: UI Polish
Tombol jelek tapi fungsional > tombol cantik yang belum di-ship. Polish setelah validasi, bukan sebelum.
OK to Defer: Scalability
Optimize untuk 1000 users dulu. Jangan build infrastructure untuk 1 juta users ketika Anda baru punya 100.
The 70-20-10 Rule untuk menjaga keseimbangan setiap sprint:
interface SprintBalance {
  featureDevelopment: number; // 70% — alasan utama bisnis membayar engineer
  qualityInvestment: number; // 20% — testing, refactoring, documentation
  exploration: number; // 10% — R&D, learning, tooling improvement
}

const healthySprint: SprintBalance = {
  featureDevelopment: 70,
  qualityInvestment: 20,
  exploration: 10,
};

// Red flags:
// - featureDevelopment > 90% → sedang membakar masa depan
// - featureDevelopment < 50% → terlalu banyak overhead
// - qualityInvestment === 0  → tech debt accumulating
// - exploration === 0        → innovation stagnation

function validateSprintBalance(balance: SprintBalance): string[] {
  const warnings: string[] = [];

  if (balance.featureDevelopment > 90)
    warnings.push("🔴 Burning future velocity — allocate time for quality");
  if (balance.qualityInvestment < 10)
    warnings.push("🟡 Tech debt accumulating — minimum 10% for quality");
  if (balance.exploration === 0)
    warnings.push("🟡 No innovation budget — team will stagnate");

  return warnings;
}
📊 3. Reporting Engineering ROI ke Stakeholders
3.1 The Engineering Investment Report
Template laporan bulanan yang menerjemahkan engineering output ke bahasa bisnis.
# Engineering Investment Report — {MONTH} {YEAR}

## Executive Summary

- Total engineering investment: Rp {X} Miliar
- Value delivered: {list of shipped features with business impact}
- Engineering Efficiency Ratio: {X}% (target: 50%)
- Key risk: {one-liner on biggest technical risk}

## Investment Breakdown

| Category       | Hours | Cost (Rp) | % of Total   |
| -------------- | ----- | --------- | ------------ |
| New Features   | X     | X         | 70% target   |
| Bug Fixes      | X     | X         | < 15% target |
| Tech Debt      | X     | X         | ~15% target  |
| Infrastructure | X     | X         | ~5%          |

## ROI Highlights

1. **{Feature A}**: Rp {X} investment → Rp {Y} projected annual value (ROI: {Z}x)
2. **{Optimization B}**: Rp {X} investment → Rp {Y} annual savings (ROI: {Z}x)

## Tech Debt Balance Sheet

| Item     | Estimated Cost to Fix | Interest Rate | Deadline |
| -------- | --------------------- | ------------- | -------- |
| {Item 1} | Rp {X}                | High          | Q2 2026  |

## Risks & Recommendations

1. {Risk 1}: {Mitigation plan}
2. {Risk 2}: {Mitigation plan}

## Next Month Focus

- {Priority 1}
- {Priority 2}
3.2 Incident Cost Calculator
Setiap downtime dan incident memiliki biaya langsung. Menghitung biaya ini membuat argument untuk investasi reliability menjadi sangat konkret.
type IncidentCost struct {
    Duration        time.Duration
    AffectedUsers   int
    RevenuePerHour  float64 // average hourly revenue
    EngineersOnCall int
    EngHourlyRate   float64
    SLABreach       bool
    SLAPenalty      float64 // contractual penalty jika applicable
}

func (i *IncidentCost) Calculate() map[string]float64 {
    hours := i.Duration.Hours()

    return map[string]float64{
        "lost_revenue":     hours * i.RevenuePerHour,
        "engineering_cost": hours * float64(i.EngineersOnCall) * i.EngHourlyRate,
        "sla_penalty":      conditionalPenalty(i.SLABreach, i.SLAPenalty),
        "reputation_cost":  float64(i.AffectedUsers) * 5000, // est. Rp 5K per affected user
        "total":            0, // sum of above
    }
}

// Contoh: Downtime 2 jam pada jam sibuk
// Lost Revenue:     2 x Rp 25 Juta = Rp 50 Juta
// Engineering:      2 x 4 engineers x Rp 200K = Rp 1.6 Juta
// SLA Penalty:      Rp 100 Juta (contractual)
// Reputation:       50,000 users x Rp 5K = Rp 250 Juta
// TOTAL:            Rp 401.6 Juta untuk 2 jam downtime
//
// Bandingkan dengan: Investasi Rp 50 Juta untuk redundancy dan monitoring
// yang mencegah downtime = ROI 8x dalam satu incident saja.
The Reliability Investment Pitch
Jangan bilang: "Kita butuh menambah monitoring dan redundancy di production."
Bilang: "Setiap jam downtime merugikan perusahaan Rp 200 Juta. Investasi Rp 50 Juta untuk monitoring dan auto-failover akan mencegah rata-rata 3 incident per tahun, menghasilkan net saving Rp 550 Juta/tahun. ROI: 11x dalam tahun pertama."
3.3 Tech Debt sebagai Balance Sheet
Template Tech Debt Balance Sheet:
Prop
Type
🎓 4. Lessons Learned
What Works
Common Mistakes
| Mistake | Kenapa Berbahaya | Solusi |
|---|---|---|
| Over-promising ROI | Kehilangan trust jika tidak deliver | Berikan range (conservative to optimistic), bukan single number |
| Ignoring opportunity cost | Keputusan yang terlihat murah sebenarnya mahal | Selalu tanyakan "apa yang TIDAK bisa kita bangun jika kita pilih ini?" |
| Treating all tech debt equal | Resource terbuang untuk utang yang low-impact | Prioritaskan berdasarkan interest rate, bukan severity |
| Building for imaginary scale | Over-engineering untuk users yang belum ada | Build untuk 10x current load, bukan 1000x |
| Not tracking engineering time | Tidak bisa menghitung ROI tanpa data | Implement time tracking (non-invasive, per category) |
🎉 Conclusion
The Engineering-ROI Bridge
Menjembatani engineering dan bisnis bukan tentang mengurangi engineering menjadi spreadsheet. Ini tentang mengartikulasikan value engineering dalam bahasa yang dipahami oleh seluruh organisasi.
Tiga prinsip utama:
- Quantify Everything — Setiap keputusan teknis memiliki price tag. Tugas Anda adalah membuat price tag itu visible.
- Think in Time Horizons — Keputusan murah hari ini bisa sangat mahal dalam 12 bulan. Selalu hitung compound effect.
- Frame as Investment — Engineering bukan cost center. Engineering adalah investasi yang, jika dikelola dengan baik, menghasilkan compound returns.
Engineer yang bisa berbicara dalam bahasa ROI tidak kehilangan identitas teknisnya — justru menjadi lebih powerful karena keputusan teknisnya mendapat backing dari seluruh organisasi.
Kemampuan menjembatani bahasa teknis dan bahasa bisnis adalah skill langka yang membedakan engineer yang "hanya coding" dari engineering leader yang membentuk arah perusahaan. Artikel ini adalah starting point — framework yang perlu diadaptasi sesuai konteks bisnis, skala tim, dan stage perusahaan Anda.
"Price is what you pay. Value is what you get." — Warren Buffett