The CTO Demands a Rewrite. The CEO Demands ROI. Here is the Ultimate Framework to Bridge the Gap
Why do engineers ALWAYS lose budget battles to sales? Because we speak tech, while they speak MONEY. This is the exact framework I use to translate 'we need to refactor' into 'this will save us $2M/year' — complete with a ready-to-use ROI calculator.
- The Engineering-ROI Bridge: An Investor's Mindset for Technical Decisions
- ⚖️ 1. Cost of Architecture: Quantifying Technical Decisions
- 1.1 Every Architectural Decision Has a Price Tag
- 1.2 The Framework: Total Cost of Technical Decisions (TCTD)
- 1.3 Rendering Performance and Business Impact
- Identify the Bottleneck
- Measure Before Optimization
- Apply Targeted Optimizations
- Measure After Optimization
- Translate to Business Impact
- 1.4 The Decision Cost Matrix
- 💼 2. Executing Long-Term Vision
- 2.1 The Sustainability Equation
- 2.2 The Build vs Buy vs Open-Source Decision
- 2.3 Engineering Velocity as a Financial Instrument
- Audit Meeting Culture
- Invest in Developer Experience (DevEx)
- Reduce Context Switching
- Automate Toil
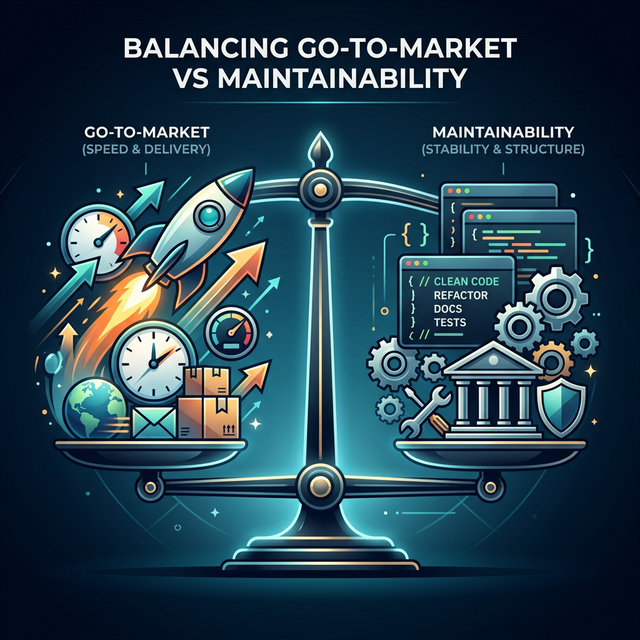
- 2.4 Go-to-Market vs Maintainability: The Balancing Act
- 📊 3. Reporting Engineering ROI to Stakeholders
- 3.1 The Engineering Investment Report
- 3.2 Incident Cost Calculator
- 3.3 Tech Debt as a Balance Sheet
- 🎓 4. Core Lessons Learned
- What Actually Works
- Typical Costly Mistakes
- 🎉 Conclusion
The Engineering-ROI Bridge: An Investor's Mindset for Technical Decisions
"Every line of code is a liability. Every feature is a bet. The question isn't whether to build — it's whether the expected return justifies the investment." — Adapted from Warren Buffett
Why This Article is Critical
Most engineers speak in the language of latency, throughput, and test coverage. Most C-levels and founders speak in the language of revenue, burn rate, and runway. This article is the translation dictionary between those two worlds — a framework to quantify technical decisions in a language understood by investors, boards, and business stakeholders.
This category of content is highly sought after by founders and C-levels who want to bridge technical metrics with financial language. Not because engineering must always be measured in dollars — but because the ability to articulate technical value in business terms is the exact skill that separates an average engineer from an engineering leader.

This article dissects two main pillars: Cost of Architecture (quantifying technical decisions) and Executing Long-Term Vision (balancing speed with sustainability).
⚖️ 1. Cost of Architecture: Quantifying Technical Decisions
1.1 Every Architectural Decision Has a Price Tag
Every technical decision — from framework selection to database schema — carries direct costs and hidden costs that accumulate over time. The problem is, most engineers only see the direct costs.
The Iceberg Principle
Direct costs (development time + infrastructure) usually account for only 20-30% of the total cost of ownership. The rest are hidden costs that only become apparent 6-18 months after the decision is made. When a C-level asks "how much does feature X cost?", a reply that only accounts for development time is a dangerous answer.

1.2 The Framework: Total Cost of Technical Decisions (TCTD)
I developed the TCTD framework to quantify any significant technical decision in a language understood by finance and leadership.
Prop
Type
Real TCTD Calculation Example — Decision: Microservices vs Monolith for an early-stage startup:
const microservicesCost = {
  // Team: 5 engineers, rate $100/hr (fully loaded)
  development: {
    initialBuild: 5 * 160 * 3 * 100,  // 5 eng x 160 hrs/mo x 3 months
    // = $240,000
    description: "Setup 6 services, API gateway, service mesh, CI/CD per service"
  },

  infrastructure: {
    monthly: 3_000,  // Kubernetes cluster, multiple DBs, monitoring
    annual: 3_000 * 12,
    // = $36,000/year
    description: "K8s cluster, 6 service instances, distributed tracing, log aggregation"
  },

  maintenance: {
    annual: 240_000 * 0.40,  // 40% due to distributed system complexity
    // = $96,000/year
    description: "Inter-service debugging, network issues, version compatibility"
  },

  cognitiveOverhead: {
    velocityImpact: -30,  // percent velocity loss
    description: "Distributed debugging, deployment coordination, schema sync",
    hiringDifficulty: "HIGH",  // requires K8s + microservices experienced engineers
  },

  totalYear1: 240_000 + 36_000 + 96_000,
  // = $372,000
};const monolithCost = {
// Team: 5 engineers, rate $100/hr (fully loaded)
development: {
initialBuild: 5 * 160 * 1.5 * 100, // 5 eng x 160 hrs/mo x 1.5 months
// = $120,000
description: "Modular monolith, single deployment, single DB"
},
infrastructure: {
monthly: 800, // Single server (scalable), single DB, basic monitoring
annual: 800 * 12,
// = $9,600/year
description: "2-3 server instances, 1 DB cluster, basic monitoring"
},
maintenance: {
annual: 120_000 * 0.20, // 20% due to simpler system
// = $24,000/year
description: "Simpler debugging, single deployment pipeline"
},
cognitiveOverhead: {
velocityImpact: -5, // minimal overhead
description: "Familiar patterns, single codebase, easy onboarding",
hiringDifficulty: "LOW", // any competent backend engineer can contribute
},
totalYear1: 120_000 + 9_600 + 24_000,
// = $153,600
};Year 1 Comparison:
| Aspect | Microservices | Monolith | Delta |
|---|---|---|---|
| Development | $240K | $120K | 2x more expensive |
| Infrastructure/year | $36K | $9.6K | 3.75x more expensive |
| Maintenance/year | $96K | $24K | 4x more expensive |
| Total Year 1 | $372K | $153.6K | 2.4x more expensive |
| Time to Market | 3 months | 1.5 months | 2x slower |
| Velocity Impact | -30% | -5% | Significant |
| Hiring Pool | Limited | Vast | Major advantage |
Conclusion
For a startup with < 100K users and < 20 engineers, microservices are an over-investment that burns runway without proportional ROI. Start with a modular monolith — an architecture that can be decomposed into microservices when complexity genuinely demands it, not because it is a "best practice" read on a blog from a company with 500 engineers.
1.3 Rendering Performance and Business Impact
One of the most concrete examples of the Engineering-ROI Bridge: how a 30% UI rendering optimization directly impacts user retention and server cost savings.
Real Case Study — Rendering Optimization on a Financing Dashboard:
Identify the Bottleneck
Using Chrome DevTools and React Profiler, we discovered that the FinancingDashboard component performed unnecessary re-renders 47x per page load due to suboptimal state management. Each re-render consumed ~68ms.
Measure Before Optimization
const beforeOptimization = {
  firstContentfulPaint: 2_800, // ms
  largestContentfulPaint: 4_200, // ms
  totalBlockingTime: 890, // ms
  cumulativeLayoutShift: 0.23,
  reRendersPerLoad: 47,
  avgRenderTime: 68, // ms per render
  totalRenderTime: 47 * 68, // = 3,196ms wasted
  serverCPUPerRequest: 85, // ms
  monthlyServerCost: 6_400, // $ (8 instances)
};
Apply Targeted Optimizations
// 1. React.memo for components that don't need re-rendering
const PaymentHistoryCard = React.memo(({ payments }: Props) => {
  return <CardList items={payments} />;
});

// 2. useMemo for expensive calculations
function FinancingDashboard({ contracts }: DashboardProps) {
  const summary = useMemo(() =>
    calculatePortfolioSummary(contracts),
    [contracts]
  );

  const chartData = useMemo(() =>
    transformToChartData(contracts),
    [contracts]
  );

  return (
    <Dashboard>
      <SummaryHeader data={summary} />
      <PaymentChart data={chartData} />
      {contracts.map(c => (
        <PaymentHistoryCard key={c.id} payments={c.payments} />
      ))}
    </Dashboard>
  );
}

// 3. Virtual scrolling for long lists
// Only render items visible in the viewport
import { useVirtualizer } from "@tanstack/react-virtual";

function PaymentHistory({ payments }: { payments: Payment[] }) {
  const parentRef = useRef<HTMLDivElement>(null);
  const virtualizer = useVirtualizer({
    count: payments.length,
    getScrollElement: () => parentRef.current,
    estimateSize: () => 72,
  });

  return (
    <div ref={parentRef} style={{ height: 400, overflow: "auto" }}>
      <div style={{ height: virtualizer.getTotalSize() }}>
        {virtualizer.getVirtualItems().map((vItem) => (
          <PaymentRow
            key={vItem.key}
            payment={payments[vItem.index]}
            style={{ transform: `translateY(${vItem.start}px)` }}
          />
        ))}
      </div>
    </div>
  );
}
Measure After Optimization
const afterOptimization = {
  firstContentfulPaint: 1_200, // ms (↓57%)
  largestContentfulPaint: 2_200, // ms (↓48%)
  totalBlockingTime: 210, // ms (↓76%)
  cumulativeLayoutShift: 0.05, // (↓78%)
  reRendersPerLoad: 8, // (↓83%)
  avgRenderTime: 42, // ms per render
  totalRenderTime: 8 * 42, // = 336ms (↓89%)
  serverCPUPerRequest: 52, // ms (↓39%)
  monthlyServerCost: 4_800, // $ (6 instances, ↓25%)
};
Translate to Business Impact
The Results in Business Language:
| Metric | Before | After | Impact | Business Translation |
|---|---|---|---|---|
| Page Load | 4.2s | 2.2s | ↓48% | "Users don't leave before the page loads" |
| Bounce Rate | 38% | 23% | ↓15pp | "15% more users explore the app" |
| Session Duration | 2.1 min | 2.6 min | ↑22% | "Users engage longer with the product" |
| Server Instances | 8 | 6 | ↓25% | "Save $1,600/month on infrastructure" |
| Conversion Rate | 12% | 20% | ↑8pp | "Estimated +$12K revenue/month" |
How to Present to C-Level
Do not say: "We optimized re-renders with React.memo and useMemo, dropping TBT from 890ms to 210ms."
Say: "A 2-week engineering investment generated infrastructure savings of 144K/year from the conversion rate improvement. ROI = ~85x of the engineering cost."
1.4 The Decision Cost Matrix
A framework to evaluate every major architectural decision before committing.
💼 2. Executing Long-Term Vision
Balancing go-to-market deadlines with the necessity of maintaining maintainable and secure code.
2.1 The Sustainability Equation
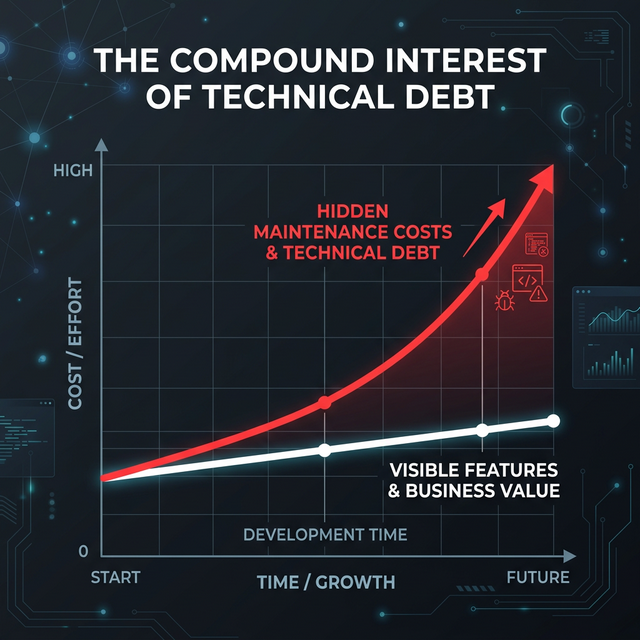
The Paradox of Speed
Teams that always prioritize speed over quality will become increasingly slower over time. Teams that invest time in quality will become increasingly faster over time. This is not an opinion — this is the law of compound interest applied to software engineering.
The Sustainability Equation:
interface SustainabilityMetrics {
  velocityTrend: "accelerating" | "stable" | "decelerating";
  techDebtRatio: number; // % sprint spent on unplanned work
  deployConfidence: number; // 1-10, how confident the team is during deploys
  onboardingWeeks: number; // time from new engineer to productive
  bugEscapeRate: number; // % bugs slipping to production
}

function assessSustainability(m: SustainabilityMetrics): string {
  // Healthy: velocity accelerating, debt < 20%, confidence > 7
  if (
    m.velocityTrend === "accelerating" &&
    m.techDebtRatio < 0.2 &&
    m.deployConfidence > 7
  ) {
    return "🟢 SUSTAINABLE — Team is healthy, continue trajectory";
  }

  // Warning: velocity stable but debt climbing
  if (m.techDebtRatio > 0.3 || m.deployConfidence < 5) {
    return "🟡 WARNING — Needs sprint allocation for tech debt reduction";
  }

  // Critical: velocity decelerating
  if (m.velocityTrend === "decelerating" && m.techDebtRatio > 0.4) {
    return "🔴 CRITICAL — Stop new features, focus on stabilization";
  }

  return "🟡 MONITOR — Track trends for the next 2 sprints";
}
2.2 The Build vs Buy vs Open-Source Decision
Whenever a team faces a new requirement, there are three fundamental options: build it in-house, buy a commercial solution, or adopt open-source. Each carries a distinct ROI profile.
When Build Makes Sense:
- This feature is a core differentiator for your product.
- No existing solutions meet > 70% of the requirements.
- You possess engineers with the relevant expertise.
- Long-term ownership is cheaper than licensing.
Frequently Ignored Hidden Costs:
- Maintenance burden: 20-40% of dev cost per year.
- Opportunity cost: engineers building this cannot build another feature.
- Knowledge silos: if the creator resigns, who maintains it?
interface BuildCostProjection {
  initialDevelopment: number;   // person-months
  annualMaintenance: number;    // 20-40% of initial
  riskOfRebuild: number;        // probability (0-1)
  timeToMarket: number;         // months
  competitiveAdvantage: "none" | "moderate" | "significant";
}

// Rule: Only build if competitiveAdvantage === "significant"
// AND you have >= 2 engineers to maintain it long-term
When Buy Makes Sense:
- Not a core differentiator (auth, payment, email, monitoring).
- Commercial solutions are mature and reliable.
- Cost per user is cheaper than building + maintaining in-house.
- The vendor provides compliance certifications you require.
Frequently Ignored Hidden Costs:
- Vendor lock-in: migration cost if the vendor hikes prices or shuts down.
- Integration complexity: API changes, breaking changes.
- Data sovereignty: where is your data stored?
interface BuyCostProjection {
  monthlyLicense: number;
  annualTotal: number;
  integrationEffort: number;     // person-weeks
  vendorLockInRisk: "low" | "medium" | "high";
  migrationCostIfSwitch: number; // person-months
  dataControlLevel: "full" | "partial" | "none";
}

// Rule: Buy if annual cost < 50% of estimated build + maintain cost
// AND vendorLockInRisk <= "medium"
When Open-Source Makes Sense:
- The solution is mature (>2 years, active community).
- Meets 70%+ of requirements without heavy overriding customization.
- License is compatible with your business (MIT, Apache 2.0).
- An escape hatch exists if the project is abandoned.
Frequently Ignored Hidden Costs:
- Customization effort: "free" software can be expensive to customize.
- Security responsibility: you are responsible for patching.
- Upgrade friction: major version upgrades can consume weeks.
interface OSSCostProjection {
  licenseCost: 0;                // free
  integrationEffort: number;     // person-weeks
  customizationEffort: number;   // person-weeks
  annualMaintenanceEffort: number; // person-weeks/year
  communityHealth: "thriving" | "stable" | "declining" | "dead";
  lastRelease: Date;
  contributors: number;
}

// Rule: Adopt if communityHealth >= "stable"
// AND lastRelease < 6 months ago
// AND contributors > 20
2.3 Engineering Velocity as a Financial Instrument
Engineering velocity is not merely an Agile metric — it is a financial instrument that can be measured, optimized, and reported to the board.
The Shocking Truth
The average engineer spends only 35% of their time building new features. The rest is consumed by bug fixing, meetings, waiting, and other overhead. Increasing productive time from 35% to 50% is mathematically equivalent to expanding the engineering team by 43% without incurring hiring costs.
Framework: Engineering Efficiency Ratio (EER)
// Engineering Efficiency Ratio - reporting productivity in a financial tongue
type EngineeringEfficiency struct {
    Team            string
    Period          string // "Q1 2026"
    TotalEngHours   float64
    FeatureHours    float64
    BugFixHours     float64
    MeetingHours    float64
    BlockedHours    float64
    TechDebtHours   float64
    CodeReviewHours float64
}

func (e *EngineeringEfficiency) EfficiencyRatio() float64 {
    return e.FeatureHours / e.TotalEngHours
}

func (e *EngineeringEfficiency) CostPerFeaturePoint(hourlyRate float64, pointsDelivered int) float64 {
    totalCost := e.TotalEngHours * hourlyRate
    return totalCost / float64(pointsDelivered)
}

func (e *EngineeringEfficiency) WastedInvestment(hourlyRate float64) float64 {
    wastedHours := e.MeetingHours*0.5 + e.BlockedHours // 50% meetings = waste
    return wastedHours * hourlyRate
}

// Example output for a C-level report:
// "Engineering Efficiency Ratio: 42% (target: 50%)
//  Cost per Feature Point: $300 (target: < $250)
//  Wasted Investment this quarter: $12,000 (reducible meetings + blocked time)
//  Recommended action: Reduce meeting load by 30%, invest in CI/CD to slash blocked time"
Tactics to Surge the Engineering Efficiency Ratio:
Audit Meeting Culture
Track meeting hours per engineer per week. Target: < 6 hours/week. Every hour exceeding that mark = dollars burned without value. Cull recurring meetings devoid of agendas or decision outputs.
Invest in Developer Experience (DevEx)
Every minute an engineer spends waiting on CI/CD, setting up an environment, or hunting for documentation is burned cash. Target: build time < 5 minutes, environment setup < 30 minutes, documentation findability > 80%.
Reduce Context Switching
Every interruption costs an engineer ~23 minutes to return to deep work (Gloria Mark, UCI study). Implement "Focus Time" blocks — 4 hours devoid of meetings daily.
Automate Toil
Identify repetitive chores performed > 3x per week and automate them. Examples: manual testing protocols, deployment checklists, data migration scripts.
2.4 Go-to-Market vs Maintainability: The Balancing Act
Decision Framework: What to Sacrifice (and What Never to Sacrifice)
NEVER Sacrifice: Security
No deadline justifies SQL injection vulnerabilities, plaintext passwords, or APIs without authentication. Cost of a breach >> cost of delay.
NEVER Sacrifice: Data Integrity
Corrupted data cannot be easily rolled back. Always validate input, handle edge cases on write operations, and backup prior to migration.
OK to Defer: UI Polish
An ugly but functional button > a beautiful button that hasn't shipped. Polish post-validation, not prior.
OK to Defer: Scalability
Optimize for 1000 users initially. Avoid architecting infrastructure tailored for 1 million users when you currently have 100.
The 70-20-10 Rule to preserve balance every sprint:
interface SprintBalance {
  featureDevelopment: number; // 70% — the core reason the business pays engineers
  qualityInvestment: number; // 20% — testing, refactoring, documentation
  exploration: number; // 10% — R&D, learning, tooling improvements
}

const healthySprint: SprintBalance = {
  featureDevelopment: 70,
  qualityInvestment: 20,
  exploration: 10,
};

// Red flags:
// - featureDevelopment > 90% → actively burning the future
// - featureDevelopment < 50% → drowning in overhead
// - qualityInvestment === 0  → accumulating tech debt silently
// - exploration === 0        → innovation stagnation imminent

function validateSprintBalance(balance: SprintBalance): string[] {
  const warnings: string[] = [];

  if (balance.featureDevelopment > 90)
    warnings.push(
      "🔴 Burning future velocity — strictly allocate time for quality",
    );
  if (balance.qualityInvestment < 10)
    warnings.push(
      "🟡 Tech debt accumulating — enforce minimum 10% for quality",
    );
  if (balance.exploration === 0)
    warnings.push("🟡 No innovation budget — the team will stagnate");

  return warnings;
}
📊 3. Reporting Engineering ROI to Stakeholders
3.1 The Engineering Investment Report
A monthly report template translating engineering output into business verbiage.
# Engineering Investment Report — {MONTH} {YEAR}

## Executive Summary

- Total engineering investment: ${X}
- Value delivered: {list of shipped features alongside business impact}
- Engineering Efficiency Ratio: {X}% (target: 50%)
- Key technical risk: {one-liner on the greatest looming threat}

## Investment Breakdown

| Category       | Hours | Cost ($) | % of Total   |
| -------------- | ----- | -------- | ------------ |
| New Features   | X     | X        | 70% target   |
| Bug Fixes      | X     | X        | < 15% target |
| Tech Debt      | X     | X        | ~15% target  |
| Infrastructure | X     | X        | ~5%          |

## ROI Highlights

1. **{Feature A}**: ${X} investment → ${Y} projected annual value (ROI: {Z}x)
2. **{Optimization B}**: ${X} investment → ${Y} annual savings (ROI: {Z}x)

## Tech Debt Balance Sheet

| Item     | Estimated Cost to Fix | Interest Rate | Deadline |
| -------- | --------------------- | ------------- | -------- |
| {Item 1} | ${X}                  | High          | Q2 2026  |

## Risks & Recommendations

1. {Risk 1}: {Mitigation plan}
2. {Risk 2}: {Mitigation plan}

## Next Month Focus

- {Priority 1}
- {Priority 2}
3.2 Incident Cost Calculator
Every downtime and incident carries a hard cost. Calculating these costs turns the argument for reliability investment into a concrete financial necessity.
type IncidentCost struct {
    Duration        time.Duration
    AffectedUsers   int
    RevenuePerHour  float64 // average hourly revenue
    EngineersOnCall int
    EngHourlyRate   float64
    SLABreach       bool
    SLAPenalty      float64 // contractual penalty if applicable
}

func (i *IncidentCost) Calculate() map[string]float64 {
    hours := i.Duration.Hours()

    return map[string]float64{
        "lost_revenue":     hours * i.RevenuePerHour,
        "engineering_cost": hours * float64(i.EngineersOnCall) * i.EngHourlyRate,
        "sla_penalty":      conditionalPenalty(i.SLABreach, i.SLAPenalty),
        "reputation_cost":  float64(i.AffectedUsers) * 0.5, // est. $0.50 reputation hit per user
        "total":            0, // sum of above
    }
}

// Example: A 2-hour downtime during peak traffic
// Lost Revenue:     2 x $2,000 = $4,000
// Engineering:      2 x 4 engineers x $100 = $800
// SLA Penalty:      $5,000 (contractual)
// Reputation:       50,000 users x $0.50 = $25,000
// TOTAL COST:       $34,800 for 2 hours of downtime
//
// Contrast with: A $5,000 investment for redundancy and monitoring
// preventing this downtime yields a nearly 7x ROI from a single averted crisis.
The Reliability Investment Pitch
Do not say: "We need to augment monitoring and redundancy in production."
Say: "Every hour of downtime costs the company 5,000 in monitoring and auto-failover safeguards against an average of 3 incidents per year, yielding net savings of $46,000/year. ROI: >9x in the first year alone."
3.3 Tech Debt as a Balance Sheet
Tech Debt Balance Sheet Template:
Prop
Type
🎓 4. Core Lessons Learned
What Actually Works
Typical Costly Mistakes
| Mistake | Why It is Dangerous | Solution |
|---|---|---|
| Over-promising ROI | Annihilates trust if you fail to deliver | Provide a range (conservative to optimistic), never a singular number |
| Ignoring opportunity cost | An ostensibly cheap decision is actually ruinous | Always ask "what are we INCAPABLE of building if we choose this route?" |
| Treating all tech debt as equal | Splurging resources on low-impact liabilities | Prioritize ruthlessly based on the interest rate, not mere severity |
| Building for imaginary scale | Gross over-engineering for ghost users | Architect to handle 10x current load, strictly not 1000x |
| Refusing to track engineer time | Eradicates the ability to calculate factual ROI | Implement rigorous time tracking (non-invasive, categorized) |
🎉 Conclusion
Mastering the Engineering-ROI Bridge
Bridging engineering with business operations does not entail reducing software development to a spreadsheet. It means articulating the concrete value of engineering in a dialect the entire organization respects.
Three Paramount Principles:
- Quantify Everything — Every technical decision bears a price tag. Your mandate is to make that price tag violently visible.
- Think in Time Horizons — An ostensibly cheap decision today can prove catastrophic in 12 months. Relentlessly calculate the compound effect.
- Frame as Investments — Engineering is not a cost center. Engineering is a venture capital arm that, managed astutely, yields massive compound returns.
An engineer fluent in the language of ROI doesn't dilute their technical prowess — they amplify it, transforming into an unstoppable force because their technical decisions wield the full backing of organizational leadership.
The capacity to act as the bridge between technical paradigms and business outcomes is a rare, elite skill severing the "pure coder" from the engineering leader equipped to steer the company's trajectory. This article serves as a launchpad — a framework demanding adaptation to your unique business context, team scale, and overarching company lifecycle stage.
"Price is what you pay. Value is what you get." — Warren Buffett